10 free capacity planning templates for Excel (one-click download)

A while ago, a dev team shared with us the spreadsheet they used to plan sprints. Developers typed their names into the days they’d spend on each task, and a COUNTIF at the bottom flagged anyone booked for two things on the same day.
We liked it because it showed whether the work fit before the sprint started (the thing most capacity plans skip). So we cleaned it up, fixed a couple of formulas, and used it as the starting point for 10 free capacity planning templates for Excel.
Capacity planning is also what we work on every day at Planyway. Our app for Jira does most of what these Excel templates do by hand, using your actual Jira issues: capacity per person, time off and holidays, workload across multiple projects, and estimates compared with logged time. If your team already plans in Jira, it’s worth a look. If not, the templates below will get you pretty far on their own.
What a capacity planning template does
A capacity planning template compares the hours your team has with the work you’re asking of it. On one side sits resource availability: working hours, time off, meetings, and part-time schedules. On the other side is project demand: estimates for the tasks, features, or tickets coming up. The gap between the two tells you whether a plan is realistic before the sprint or quarter starts.
Before a sprint or quarter starts, you want to know if the plan fits. A capacity planning template helps to check. Resource management is about the people — who they are, what they can do, when they're available. Capacity management is about time — how many hours they have and how much is already taken. Resource allocation is where you assign them to work. Good project management needs all three, and project managers usually end up juggling them in the same spreadsheet. Each template below covers one piece of that, so choose based on the question you're trying to answer.
10 capacity planning templates, from quick math to long-range planning
The list starts with a simple spreadsheet and gets more detailed as it goes. The first few take minutes to fill in; the last ones are for planning across teams, skills, and months. All of them are downloadable templates in .xlsx format with example data already in place. You type into the cream cells, and the sheet does the counting and builds the color-coded view on its own, so you get a clear overview without writing a single formula.
1. Team capacity calculator
For when someone asks, “Can we fit this in?” and you have ten minutes to answer
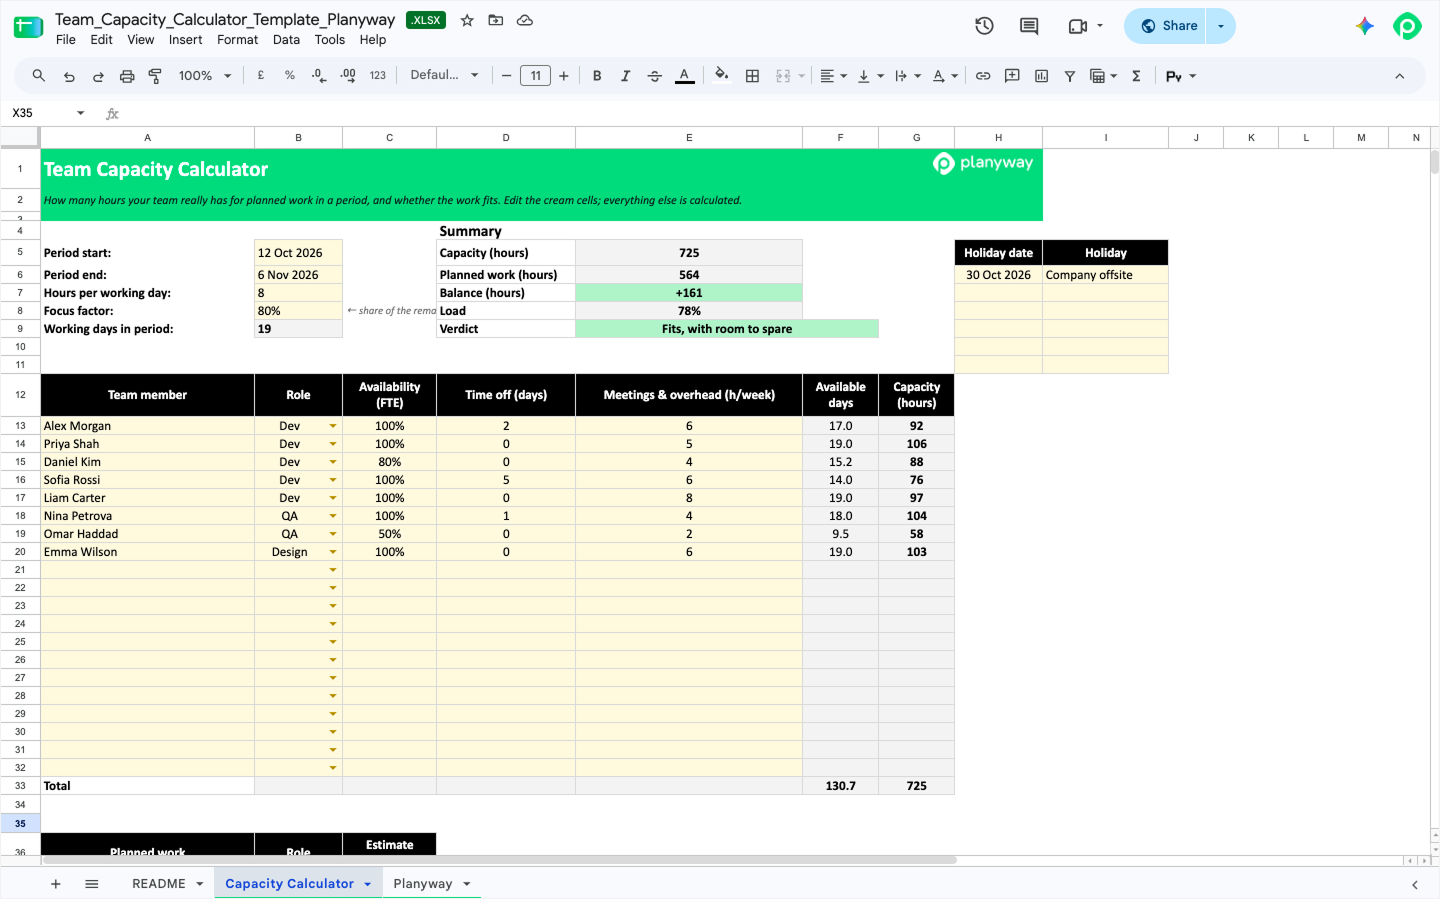
The calculator turns your team’s real availability into hours. You set the period, hours per day, and public holidays, then list team members with their role, the share of their time they spend on this team, days off, and weekly meetings. A focus factor takes out the time that goes to interruptions, and the planned work list has a line for a bug-fixing buffer, so unplanned work isn’t forgotten. The summary compares the available hours with planned work and gives a verdict.
The role breakdown matters more than it sounds. A team can have hours to spare overall and still be short on QA or design, and the by-role table shows the load for each role separately. It works for a sprint, a month, or a release, and helps you make informed decisions fast. It only shows whether the totals add up, though, not who’s overloaded on which day.
2. Sprint capacity planner
For the sprint where development finishes on time, and everything waits in QA
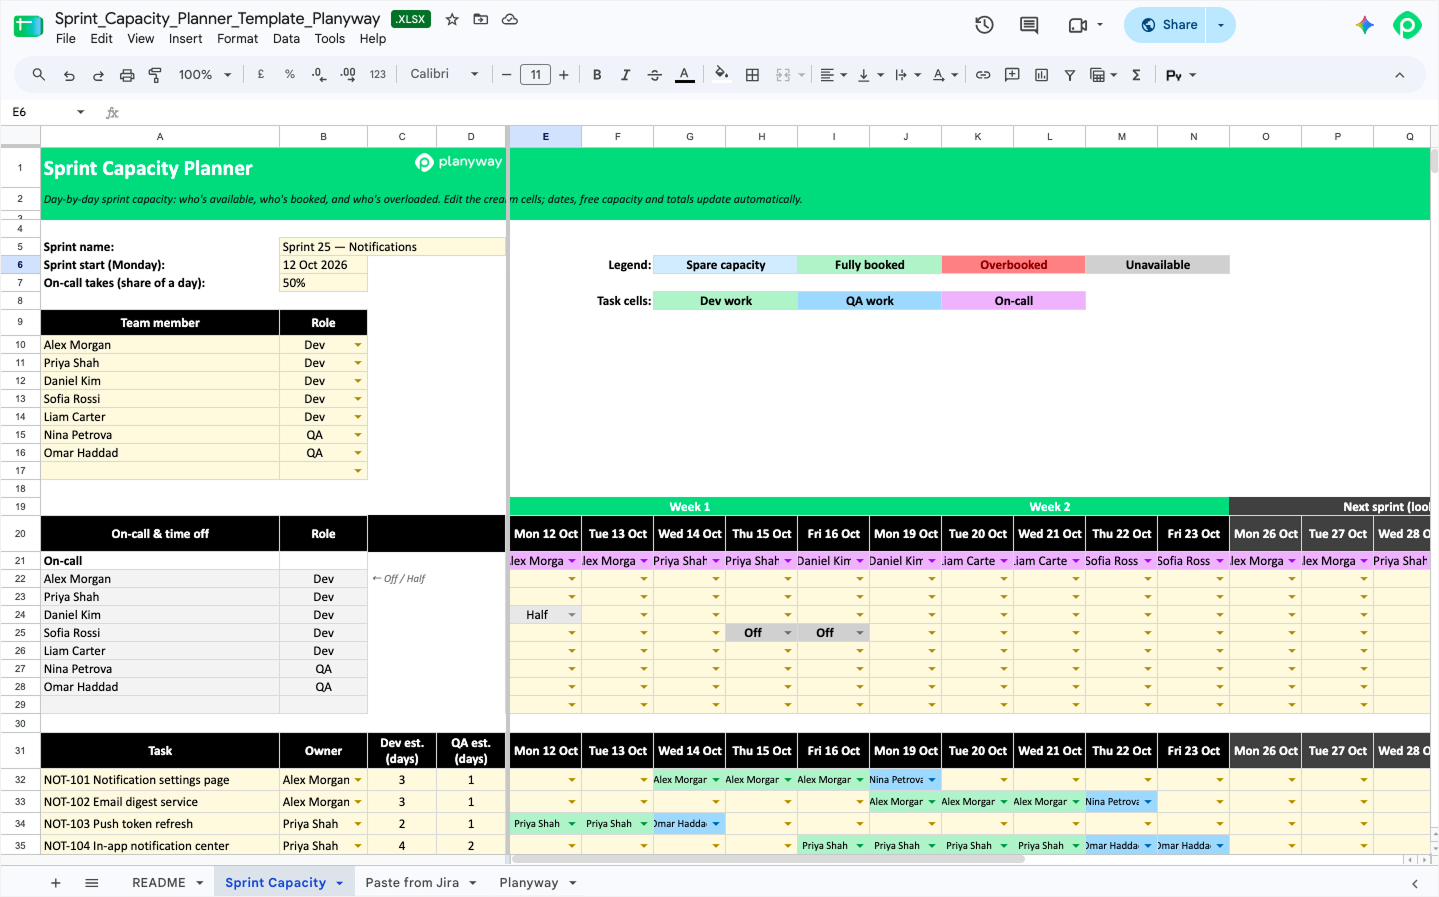
This one plans a two-week sprint day by day. You paste in your task export, so you don’t have to retype any estimates. You pick who works on each task on each day, mark days off, half days, and on-call days, and the Capacity tab shows how much of each person’s day is left. Overbooked days turn red.
Development and testing are counted separately, so you see when QA turns into one of those potential bottlenecks in week two, before the sprint starts. It’s the most detailed task breakdown of the set, built for agile sprints where you need to know who’s doing what on Thursday. Five extra days look ahead into the next sprint for work that spills over. If your team plans in story points only, #5 is simpler.
3. Weekly resource capacity planner (heatmap)
For the team where half the people are on two projects, and nobody can say who’s at 120%
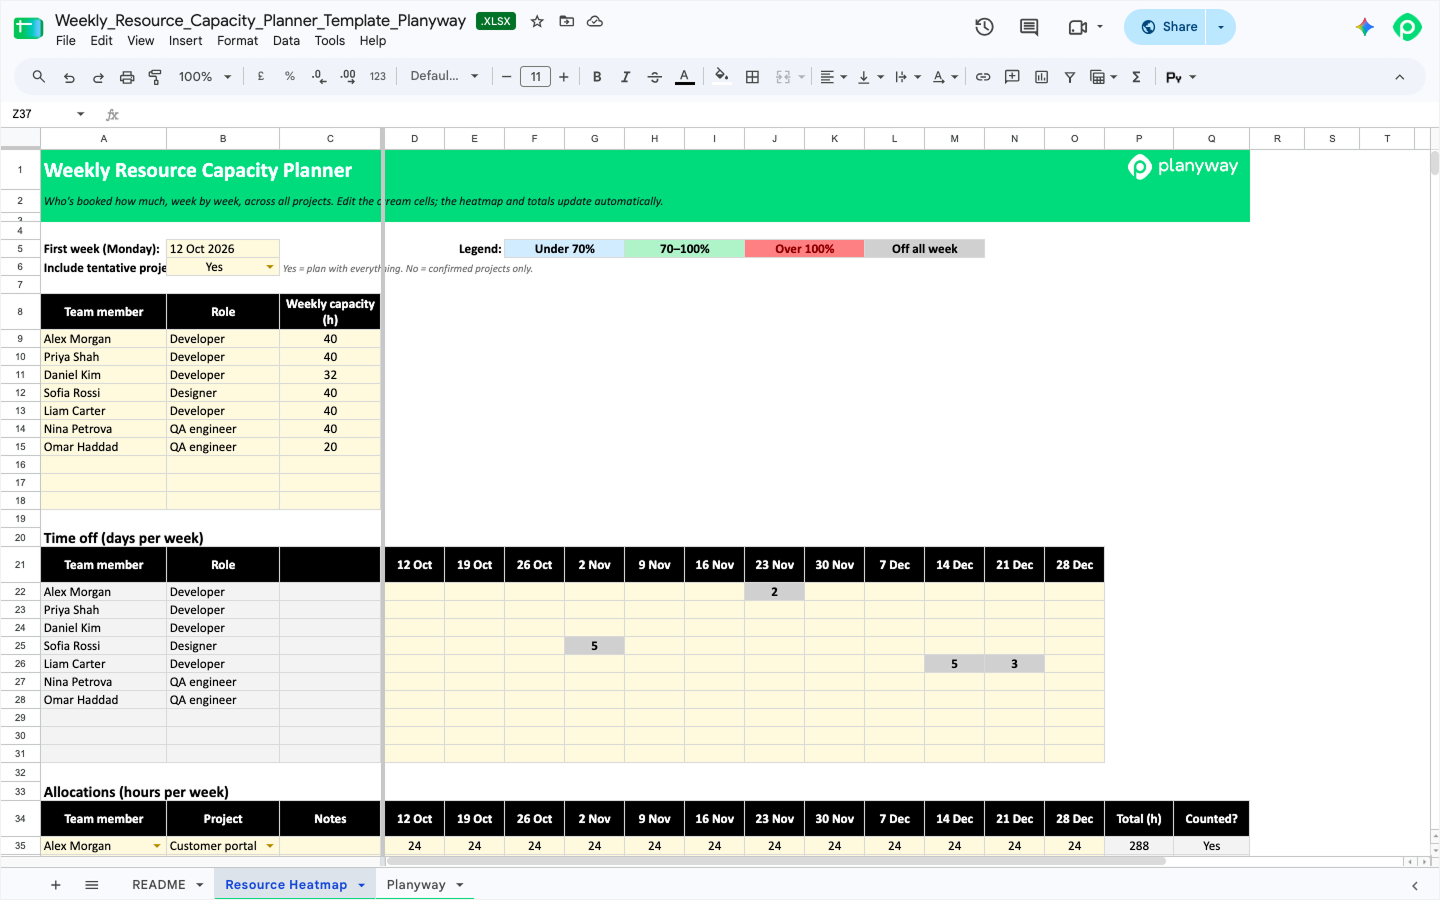
Each row is a person on a project with planned hours per week. The heatmap adds it all up against their weekly capacity, minus time off, for the next 12 weeks: under 70% shows blue, 70–100% green, over 100% red. If someone is off for the whole week but still has hours planned, the cell shows a huge overload on purpose, so the conflict doesn’t hide.
Two additions came straight from the pains we heard. A utilisation by role table shows team utilization for each role and for the whole team, which is easier to bring to leadership than a person-by-person view. And any of the upcoming projects you’re only considering can be marked Tentative. One switch adds them to the plan or takes them out, so you see which overloaded resources turn red before you say yes. The Hours by project table sums up hours by project names, so you can see which project is eating the team’s time. It works in hours and weeks, which makes it too coarse for day-by-day sprint work.
4. Team availability & time-off calendar
For the release date that looked fine until three people turned out to be off the same week in August
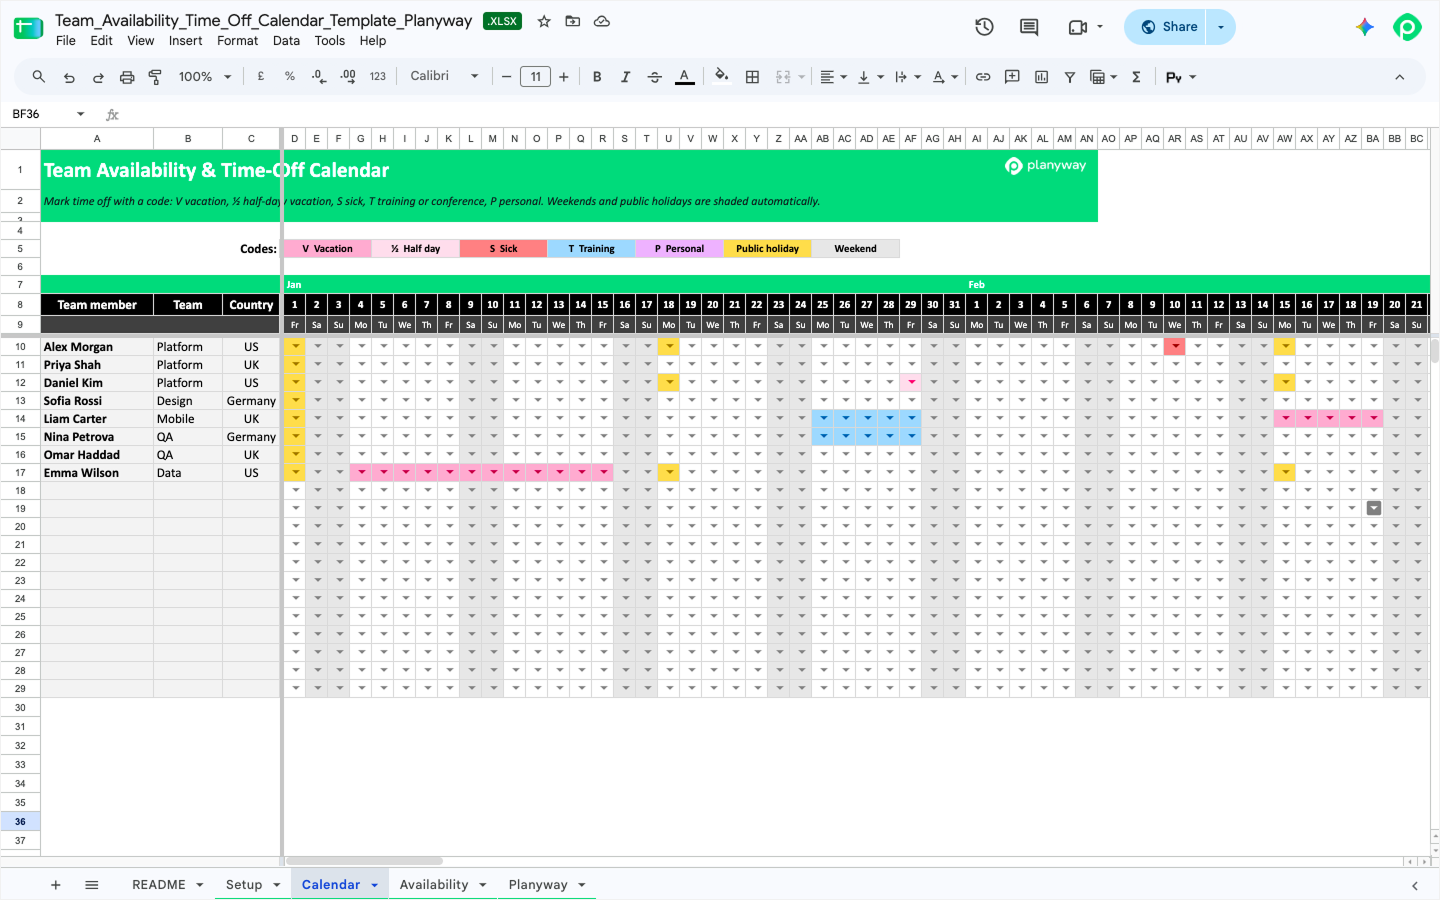
Every other capacity plan depends on knowing who’s around, and this calendar handles that part for a whole year. Vacations, sick days, training, personal days, and half days get a one-letter code. Weekends and public holidays are shaded automatically for each person’s country. The US, the UK, and Germany come pre-filled for 2027, including all 11 US federal holidays, and you can add any other country to the list.
The Availability tab turns it all into available working days per person and month, plus vacation used and left. Check the team total before you commit to project deadlines: summer and late December usually have fewer working days than you’d expect, and project timelines that ignore that tend to slip. It doesn’t track any work, so pair it with one of the other templates.
5. Agile capacity in story points
For the sprint after two people were out, when velocity dropped, and nobody knows why
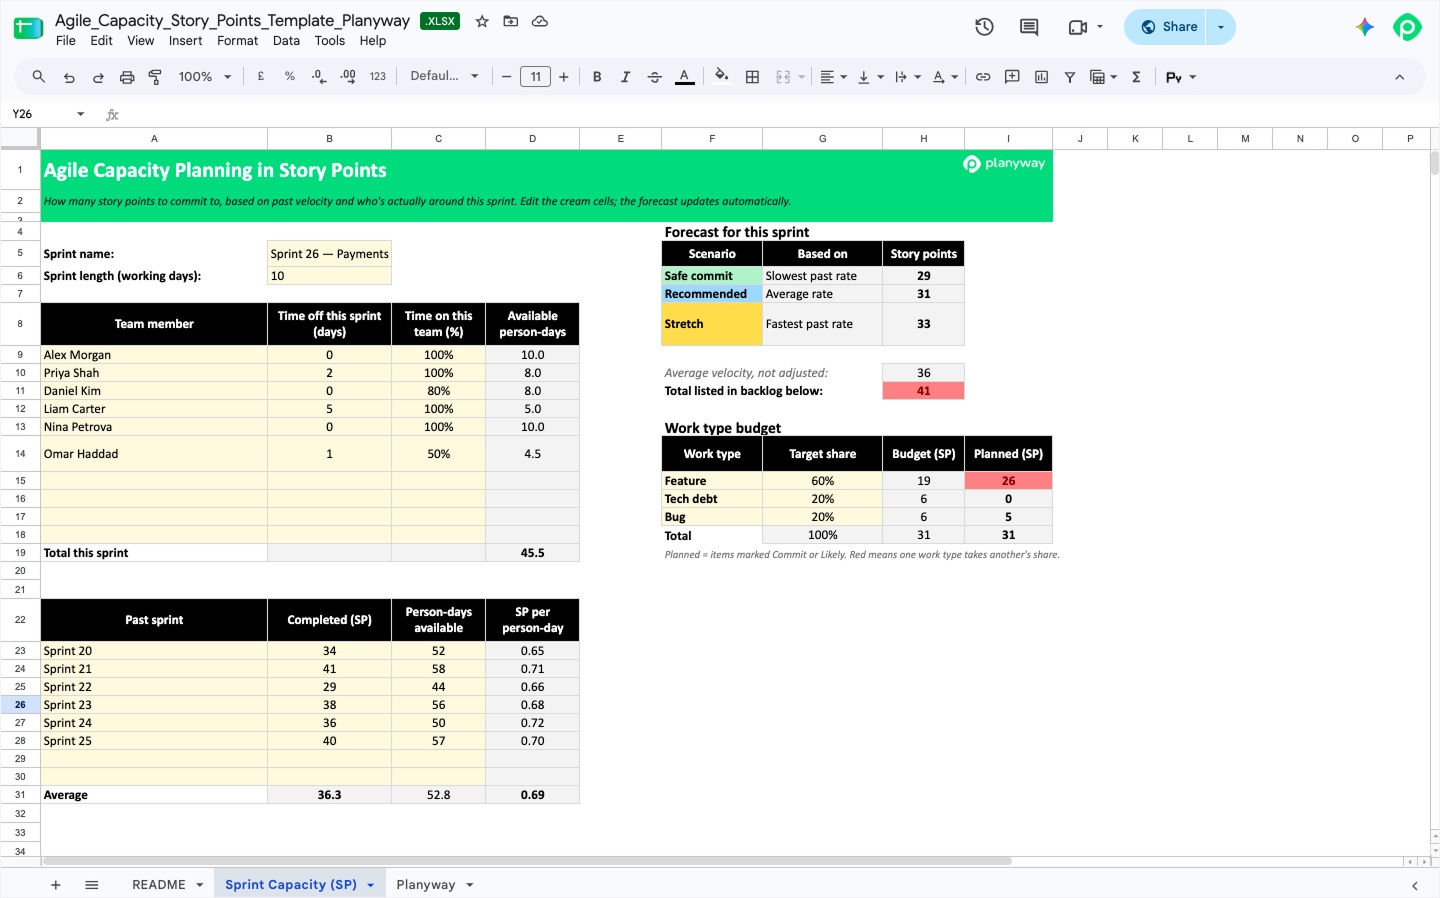
Average velocity is a decent guide until half the team is away. This template divides each past sprint’s completed story points by the person-days the team had, then multiplies that rate by this sprint’s availability. Using historical data this way gives you three numbers: a safe commit, a recommended one, and a stretch.
Your backlog goes in priority order, and each item is marked Commit, Likely, Stretch, or Next sprint. A budget by type of work (features, maintenance, tech debt) shows when features are crowding everything else out, which is how many teams lose their tech-debt time without noticing. It’s built for Scrum teams that estimate in points. If you need to know who works on what on which day, #2 is the better fit.
6. Sprint capacity: plan vs. actual
For the retrospective that keeps ending with “we underestimated again"
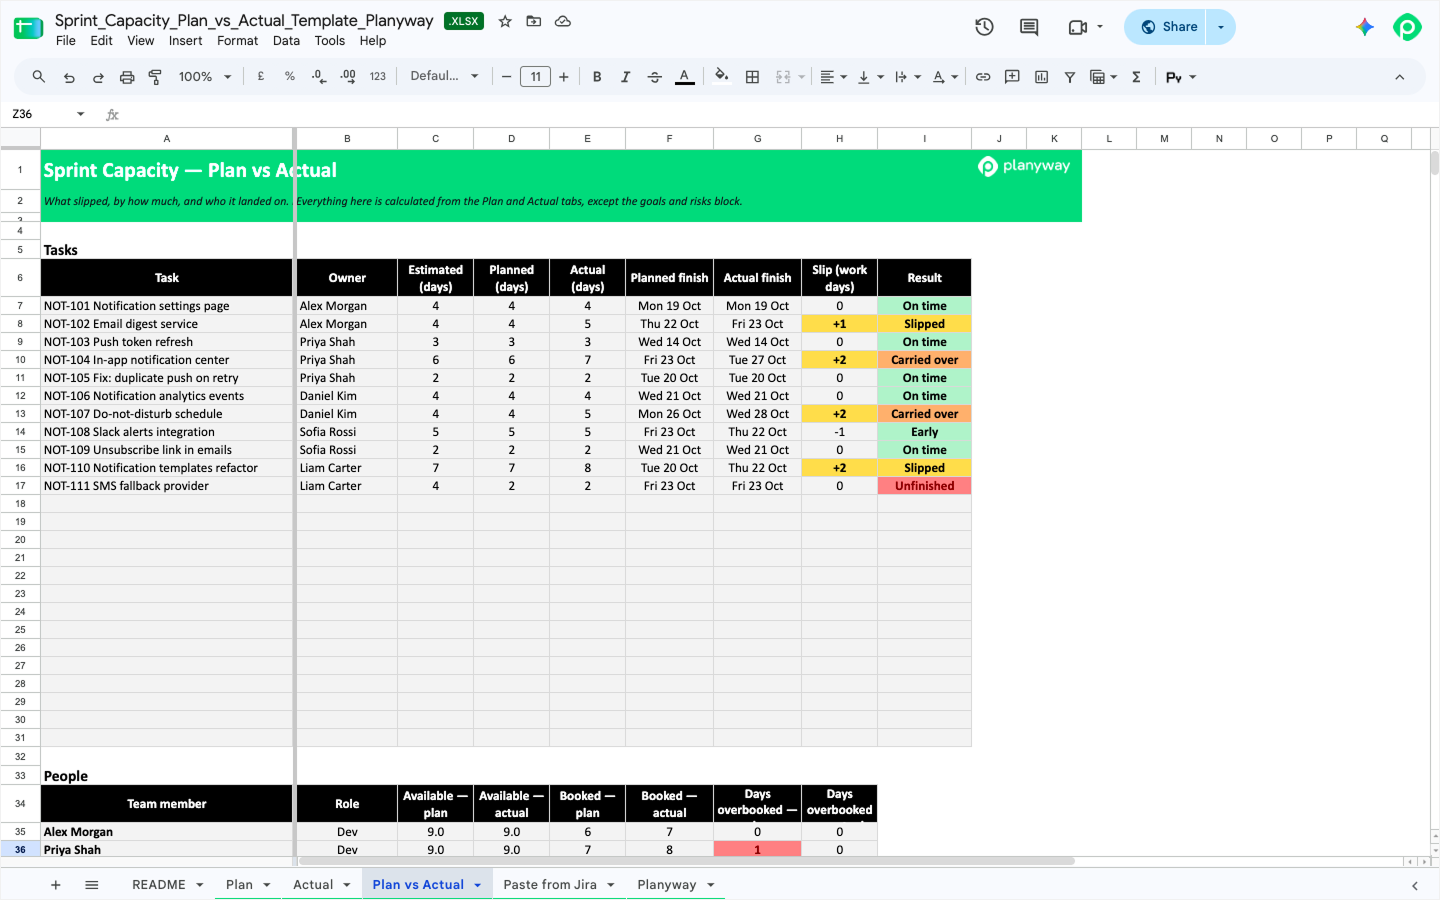
You fill in the plan before the sprint and record what really happened during it, and the Plan vs Actual tab lines them up. Each task gets a result (on time, early, slipped, carried over, or unfinished), with the slip counted in working days. Estimates can come from a Jira export through the Paste from Jira tab, so there’s no second round of data entry.
Next to the estimated effort for each task, a per-person table compares planned and actual availability and booked days, and that’s usually where the reason behind missed deadlines shows up. The template also suggests a focus factor for your next plan: the share of available person-days that turned into finished work. A sprint-goal block tracks how the risk to each goal has changed since planning. It makes a good weekly review too, as long as someone updates the Actual tab during the sprint.
7. Team capacity by stage (quarterly)
For the quarter where every team says yes and nothing ships
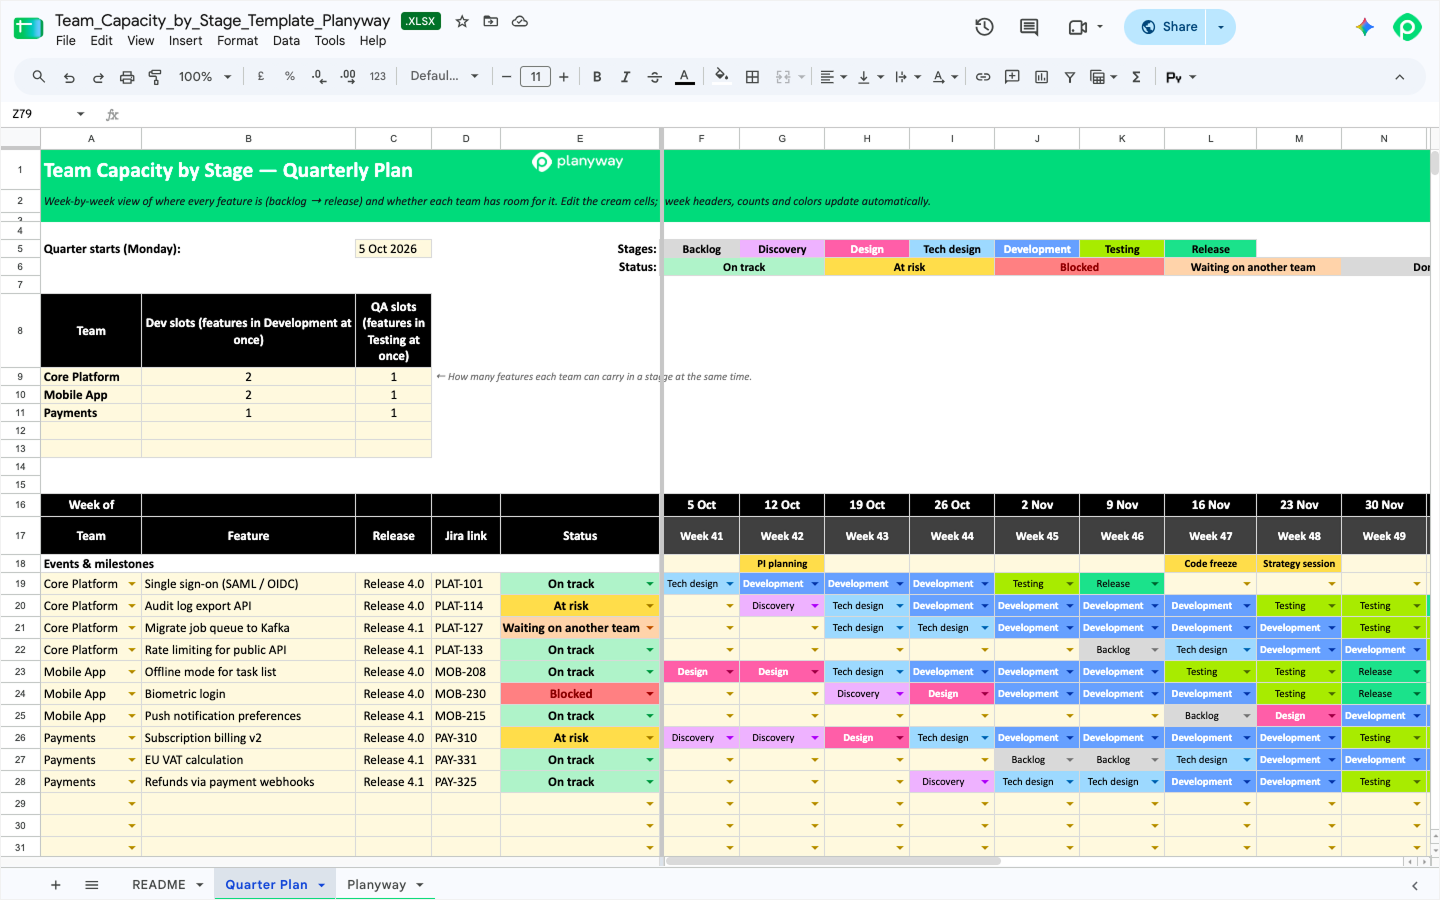
This one zooms out. Each feature moves through stages week by week, from backlog and discovery to development, testing, and release. Each team gets a limit on how many features it can carry in development and in testing at once, and when a team takes on more than that in a given week, the capacity check turns red.
Features can depend on each other, and the template flags any feature that starts development before the one it depends on ships. That makes task dependencies visible across teams and helps cross-functional collaboration when Platform’s work blocks Checkout’s. It helps you forecast resource needs per team and is made for delivery and engineering managers, and for long-term planning when someone asks whether a new feature can still make this quarter. It doesn’t count hours or people, so it tells you which team is overloaded, not who.
8. Skills-based capacity matrix
For the team with plenty of hours and one person who can touch the mobile app
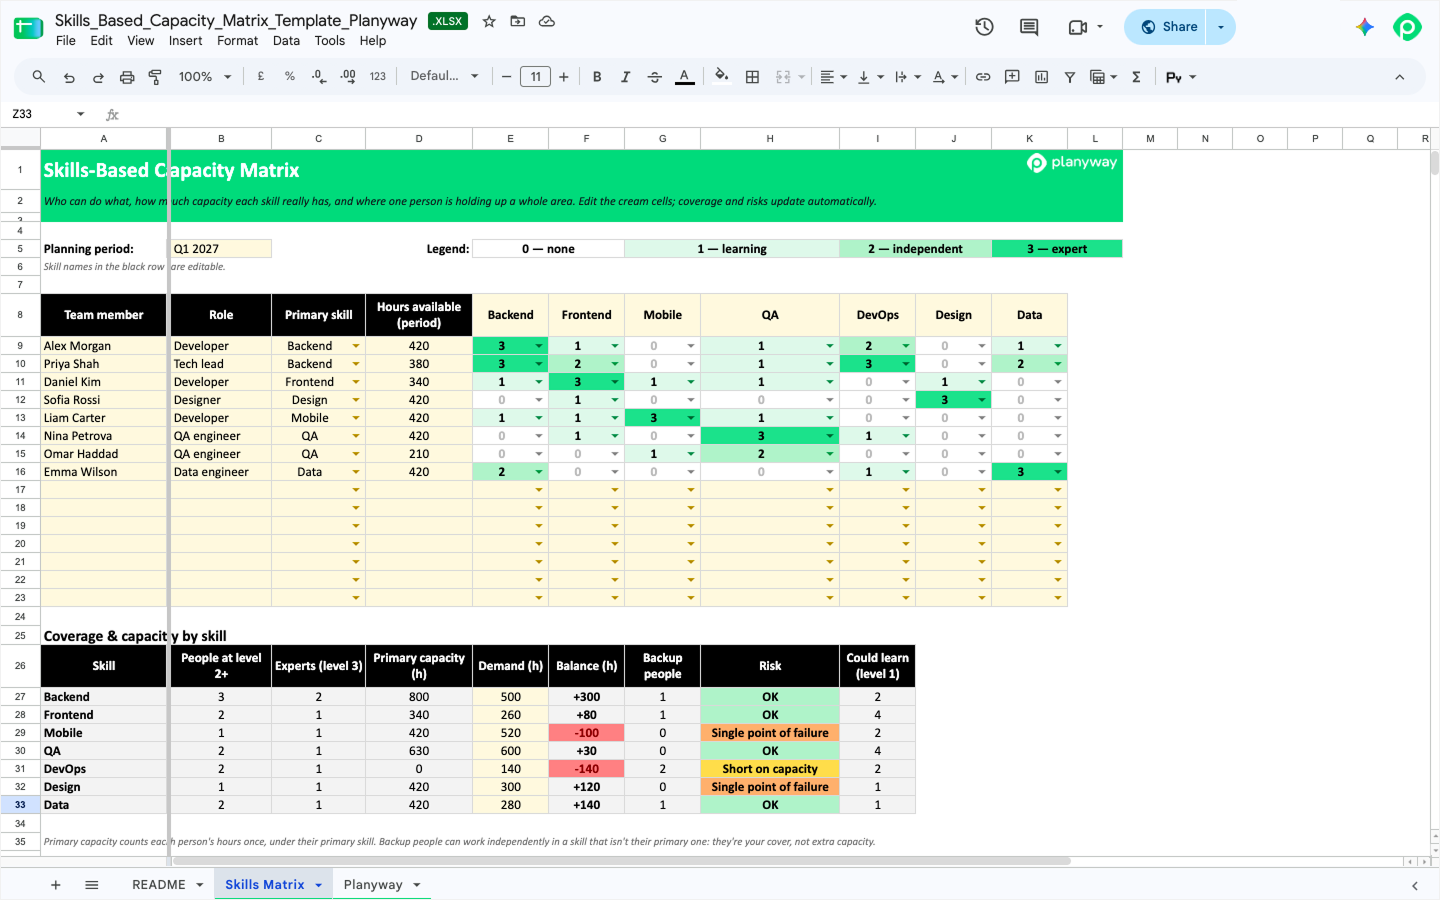
Everyone gets a 0–3 rating in each skill, a primary skill, and available hours. You add how much work each skill needs, and the summary compares capacity with demand.
Skills with no coverage or a single point of failure are flagged, and a “could learn” column counts people rated 1 who might grow into the role. That’s basically your list for pairing and training sessions next quarter, and a fairer view of workload distribution than hours alone. Update it once a quarter, not every week. Rate the skills together with the team, by the way. People are usually more honest about their own level than you’d expect.
9. Resource utilization tracker
For the agency owner who suspects the team is busy but not billable
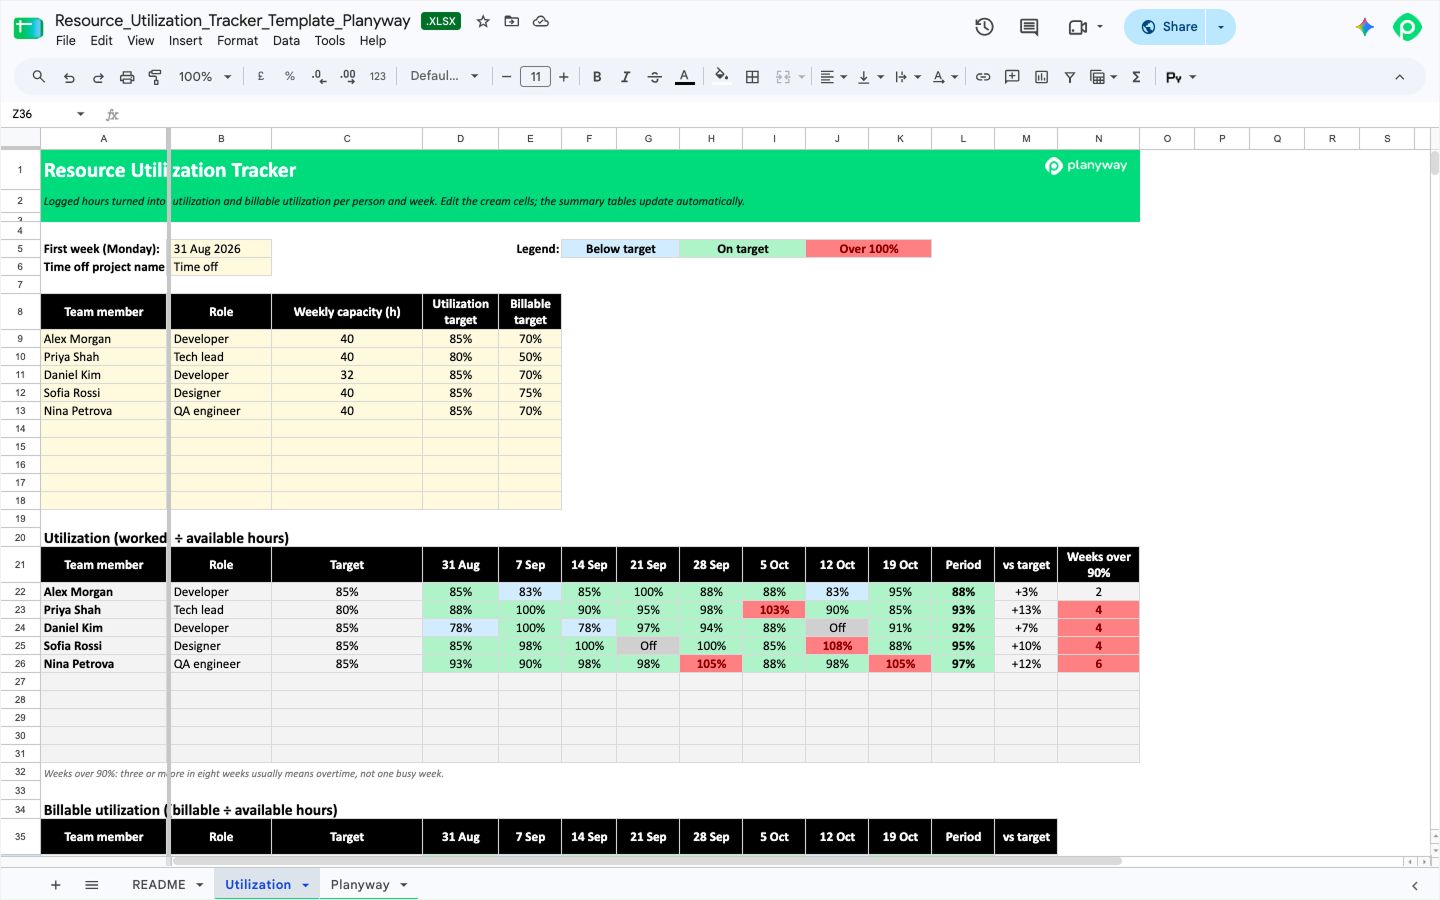
The other templates plan ahead, and this one looks back. Hours per person, project, and week go into a log (or come from a time tracking export), and the tracker calculates utilization and billable utilization for each person over eight weeks against their targets. Time off comes out of available hours, so a vacation week doesn’t look like a slow one.
Agencies and consultancies get the most from the billable hours view. For context, SPI Research’s 2026 benchmark puts average billable utilization at 66.4%, the lowest in the history of its survey. Everyone else can use total capacity utilization to check whether the 80% you planned for happened. And 100% isn’t the goal: the tracker counts the weeks each person spends above 90%, because someone who sits there week after week is probably working overtime. Those counts are some of the most actionable insights in the whole set.
10. Support team capacity planner
For the support lead who finds out on Monday that the queue doubled
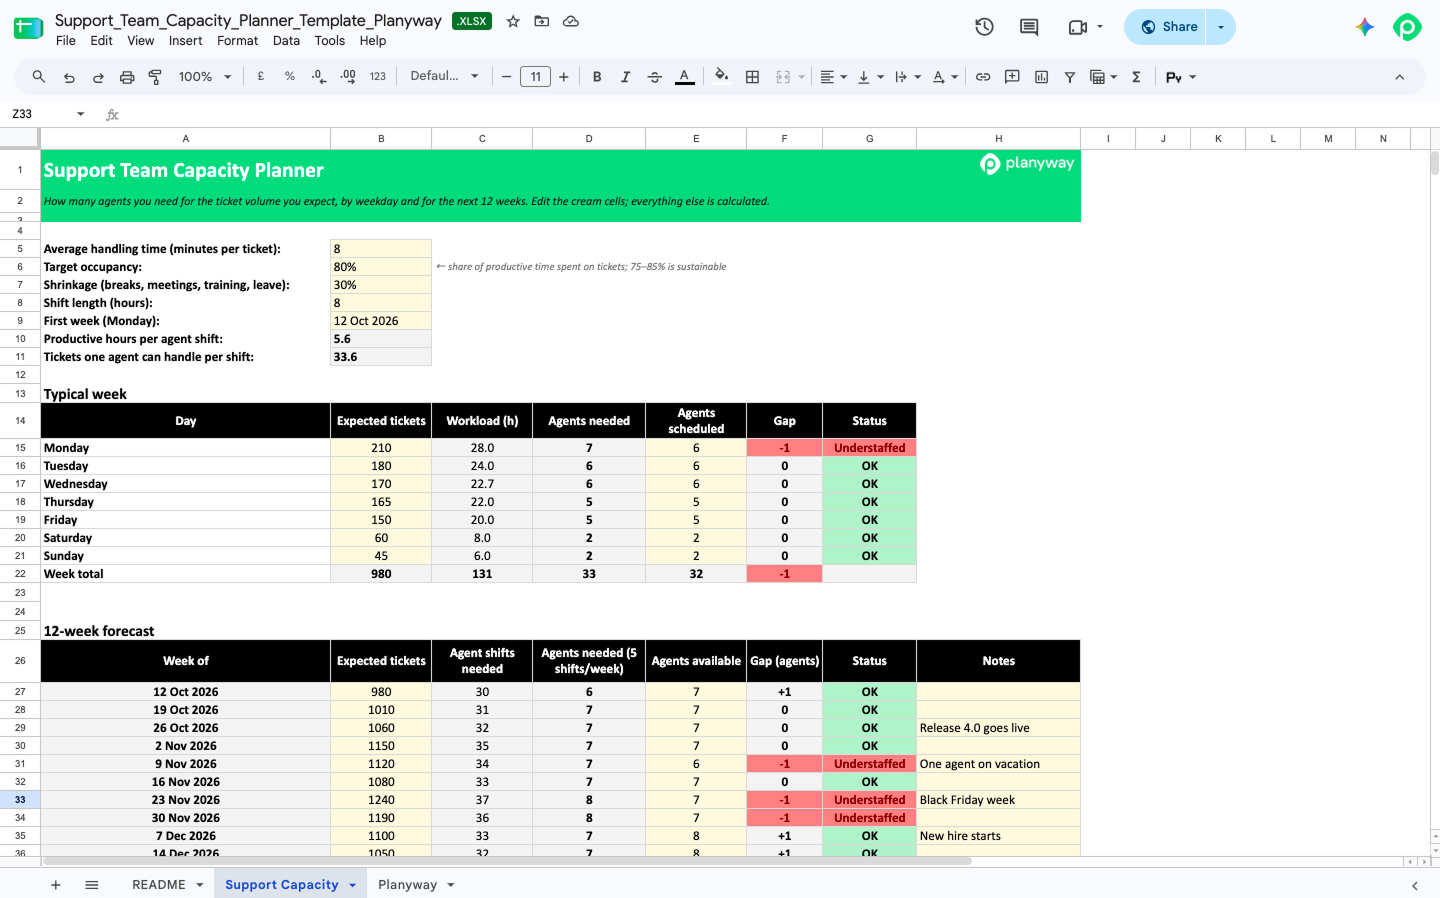
Support teams plan capacity the other way around: new tasks arrive on their own, and you need enough people to handle them. You enter expected tickets, average handling time, target occupancy, and shrinkage, and the planner shows how many agents you need for each weekday and for the next 12 weeks, next to how many you have.
The defaults follow common contact-center benchmarks: shrinkage of 30–35% and occupancy around 75–85%, since agents pushed past 85% tend to burn out. Understaffed days and weeks turn red, so you can fix shifts before the queue grows. It’s made for service desks, IT support, and customer support teams, including the ones running Jira Service Management. For project teams, it’s the wrong tool, since it assumes a steady stream of similar tickets.
How to calculate team capacity
Most of the templates above use the same formula:
Capacity = (working days × hours per day × availability − time off − meetings) × focus factor
Say you have five people and a two-week sprint. That’s 5 × 10 × 8 = 400 hours. One person takes three days off, so you’re at 376. Everyone spends about five hours a week in meetings, which takes out another 50, and you’re at 326. Then there’s the focus factor. People get pulled into code reviews, questions from other teams, and small fixes, so we usually count about 80% of the remaining time. That leaves around 260 hours of available capacity, your team’s capacity for planned work.
400 and 260 are two very different plans, and teams that plan from the first number usually end up working evenings. If you don’t know your focus factor yet, start with 70–80% and adjust it after a few sprints. Template #6 calculates a suggested value for you from your own sprint.
Two more formulas show up in templates #3 and #9:
- Resource utilization = planned (or logged) hours ÷ available hours
- Billable utilization = billable hours ÷ available hours
A spreadsheet works from a snapshot, so the moment someone re-estimates a ticket in Jira, the numbers are out of date. Real-time data in a planning tool fixes that. We cover the calculation in more detail in our guide to Jira capacity planning, if you want a deeper dive.
Which template fits your role
If you’re not sure where to start, this might help:
| Your role | The question you get asked | Start with |
|---|---|---|
| Team lead | “Can we fit this in?” | #1 Team capacity calculator, then #2 Sprint capacity planner |
| Scrum master | “How much should we commit to?” | #5 Agile capacity in story points, #6 Plan vs. actual |
| Resource manager | “Who has time for the new project?” | #3 Weekly heatmap, #4 Availability calendar |
| Delivery or engineering manager | “Will this make the quarter?” | #7 Capacity by stage, #8 Skills matrix |
| Agency owner or operations manager | “How much of our time is billable?” | #9 Utilization tracker |
| Support lead | “Do we have enough agents next week?” | #10 Support team capacity planner |
The calendar (#4) works with any of the others, since all of them need to know who’s out. The quarterly and skills templates have a steeper learning curve than #1, so start small if you’re new to this.
Common capacity planning mistakes
Planning to 100%
If you plan the sprint in the last hour, one bug is enough to throw it off. Plan for about 80–85%, and if there’s time left at the end, pull in more work. Templates #1 and #2 keep a buffer for unplanned work for exactly this reason.
Adding time off too late
People book vacations weeks ahead, but those days often get into the plan on the Friday before. Make sure to check the calendar before sprint planning. The heatmap in #3 flags weeks where someone is off but still has hours planned.
Treating velocity as a fixed number
If two people were out last sprint, lower velocity doesn’t mean the team got slower. Template #5 divides velocity by the person-days the team had, so time off doesn’t skew the forecast.
Counting part-time people as full-time
If someone splits their week between two teams, they don’t have 40 hours for either of them. Put their real share in the availability column and their real hours per day if they work a shorter day.
Not counting QA separately
A team can have plenty of development hours and still run out of testing time at the end of the sprint. That’s why #1 and #2 show capacity by role.
Planning every stage with one assignee
This one came up again and again in our interviews. A task has a developer, a tester, and sometimes a separate person for deployment, each with their own estimate, but the plan only knows the main assignee. Your team workloads for QA and DevOps then look empty when they’re full. Split the work by stage, the way #2 and #7 do, so each person’s share of project work lands in their own row, and you can identify potential bottlenecks before they show up in the sprint.
When a spreadsheet stops being enough
A spreadsheet is more powerful than its reputation suggests, and for a small team, these templates may be all you need. That holds until the plan has to stay in sync with Jira. There’s no seamless integration between the two, so someone exports issues, updates the file, and does it all again when estimates change.
That’s where capacity planning software earns its additional cost, and where Planyway for Jira comes in.
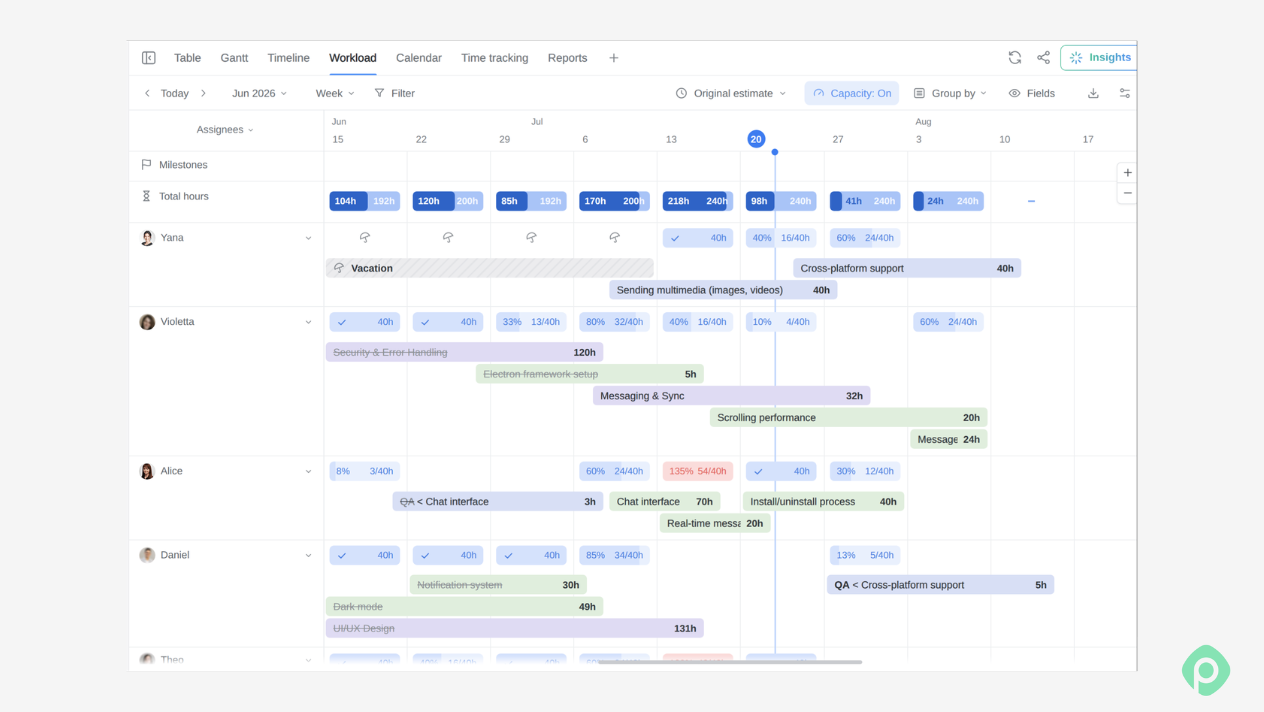
Planyway reads your Jira issues and estimates and shows each person’s scheduled work against their own capacity. These are the key features that replace the spreadsheet work above:
- Real working hours for each person. You set how many hours someone works on each day of the week, so a part-timer or someone on a four-day week isn’t counted as a full 40 hours.
- Holidays and time off taken into account. Pick the country a person works in, and public holidays are excluded from their capacity on their own. Vacations, sick days, and other days off go right on the timeline and are subtracted the same way.
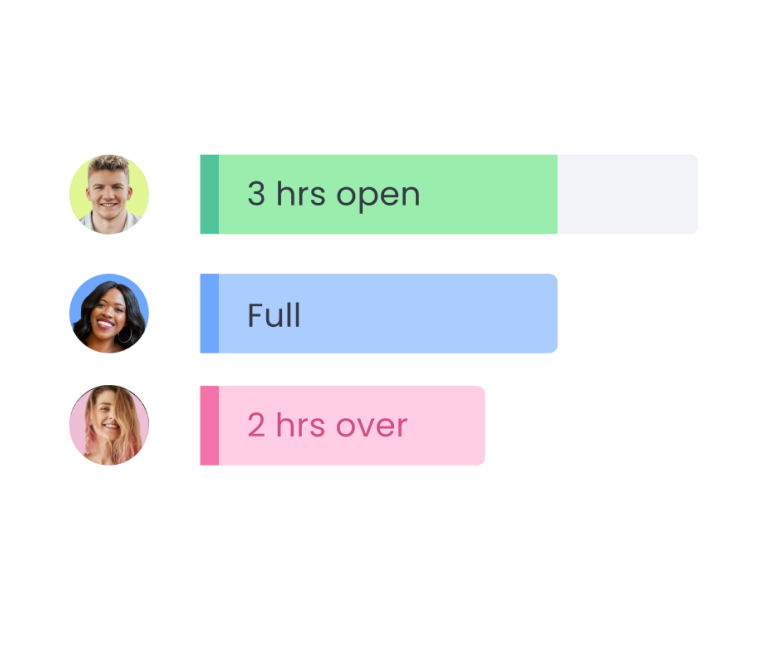
- See who’s overloaded at a glance. Color-coded workload indicators show who has too much work and who has room. You can look at it day by day or over months, for the whole team or for each person, across all your Jira projects.
- Share one task between people. If a task needs both a developer and a tester, you can split it between them and give each person their own estimate. That fixes the Dev-and-QA problem from the sprint template.
- Reports that show the bigger picture. The Workload report compares planned work with available capacity, and the Planned vs. Tracked report compares your estimates with the time people actually logged in Jira.
If your team doesn’t work in Jira and you’re shopping for a resource management tool, these templates still help. They show you which numbers actually matter to you, and that makes it much easier to locate a powerful tool that fits your tech stack.


FAQ
You plan the capacity of your team in four steps. Start with each person’s working hours for the period, subtract time off and meetings, apply a focus factor of around 70–80%, and compare the result with the estimated work. If the planned work is above about 85% of that number, the plan is too tight. Template #1 does this math for your team members in a few minutes.
There are free capacity planning templates for Excel, including the 10 in this article. Each free capacity planning template opens in Excel or Google Sheets, and every free template comes with example data and formulas already in place. They range from a quick team capacity calculator to resource planning templates for quarterly, skills-based, and support-team planning.
The best tool for capacity planning depends on team size and where your work lives. A spreadsheet is enough for one small team planning a sprint at a time. Teams seeking to plan across several projects in Jira usually move to a dedicated tool such as Planyway, so capacity, time off, and estimates stay in sync with the issues themselves. Teams that need to see availability across a whole company may need full resource planning software.
Capacity planning is calculated by multiplying working days by hours per day and each person’s availability, then subtracting time off and meetings — and applying a focus factor. Planned work divided by that number gives you capacity utilization. Most teams aim for 80–85%, so there’s room for bugs and urgent requests.
You write a capacity plan by covering six things: the period, the people and their availability, the expected demand, the gap between them, the decisions you’re making about that gap, and the date you’ll review it. Keep the key metrics to a few numbers people can act on, such as available hours, planned hours, and utilization by person. That makes informed decision-making possible for everyone who reads it. The templates above give you the numbers; the decisions are the part only you can add.
Capacity planning works the same way in different industries, but the unit changes. On production lines, production capacity is measured in units per shift. In hospitals, staffing plans count nurses per shift, because patient care suffers when wards run short, and planning ahead leads to better outcomes. Operations managers use the same math to streamline processes wherever demand and staff have to meet. The real power of capacity planning in any of these fields is seeing the gap before it hits.